Global users, after completing the login process, will be able to see information on all their de-icing stations.
The list of stations is displayed on the right of the screen as shown below:
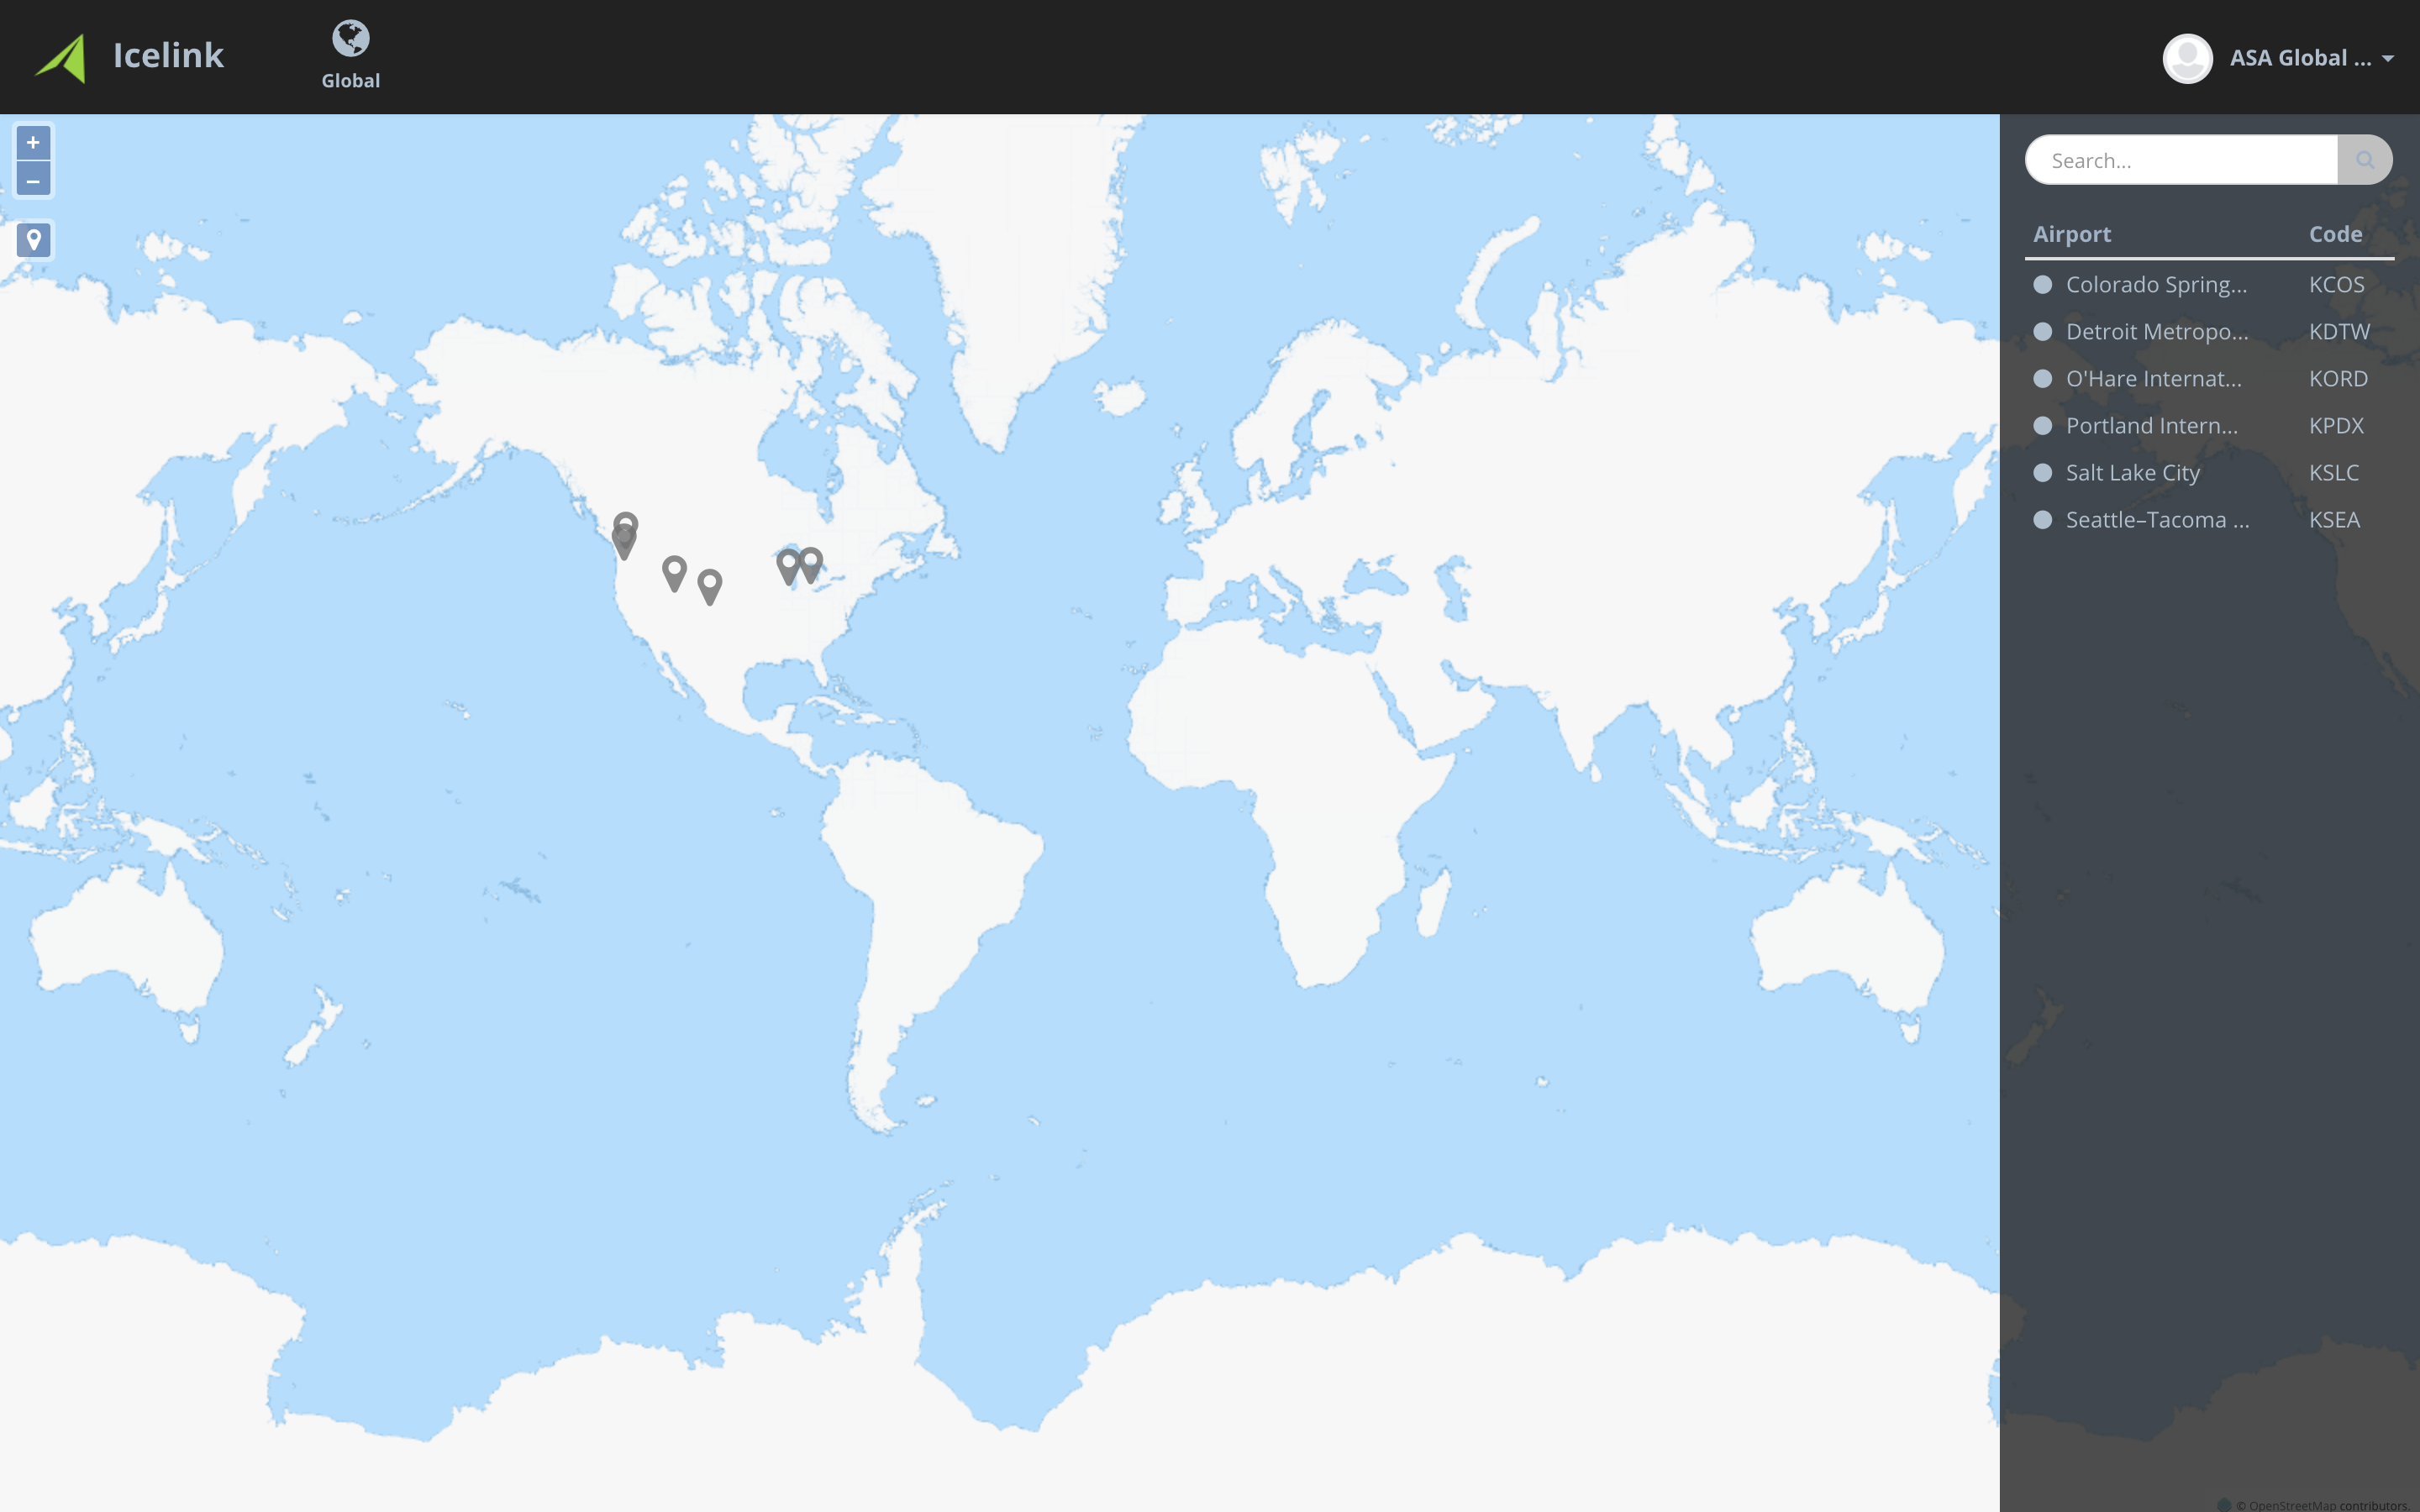
To access the performance dashboard of a particular station, see the following instructions
- Select a station by clicking on it in the right hand column;
- When a station is selected, a pop-up window will appear and display a dashboard with current operational performance information:
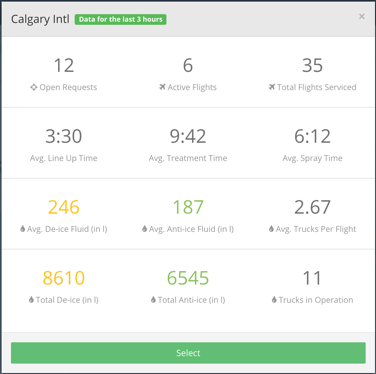
- To access more detailed information for the station, click the ‘SELECT’ button,
Information Pages:
Real Time Dashboard:
The real-time dashboard is accessed by clicking on the ‘DASHBOARD’ icon in the upper left area of the toolbar on the main Icelink® screen, as indicated:

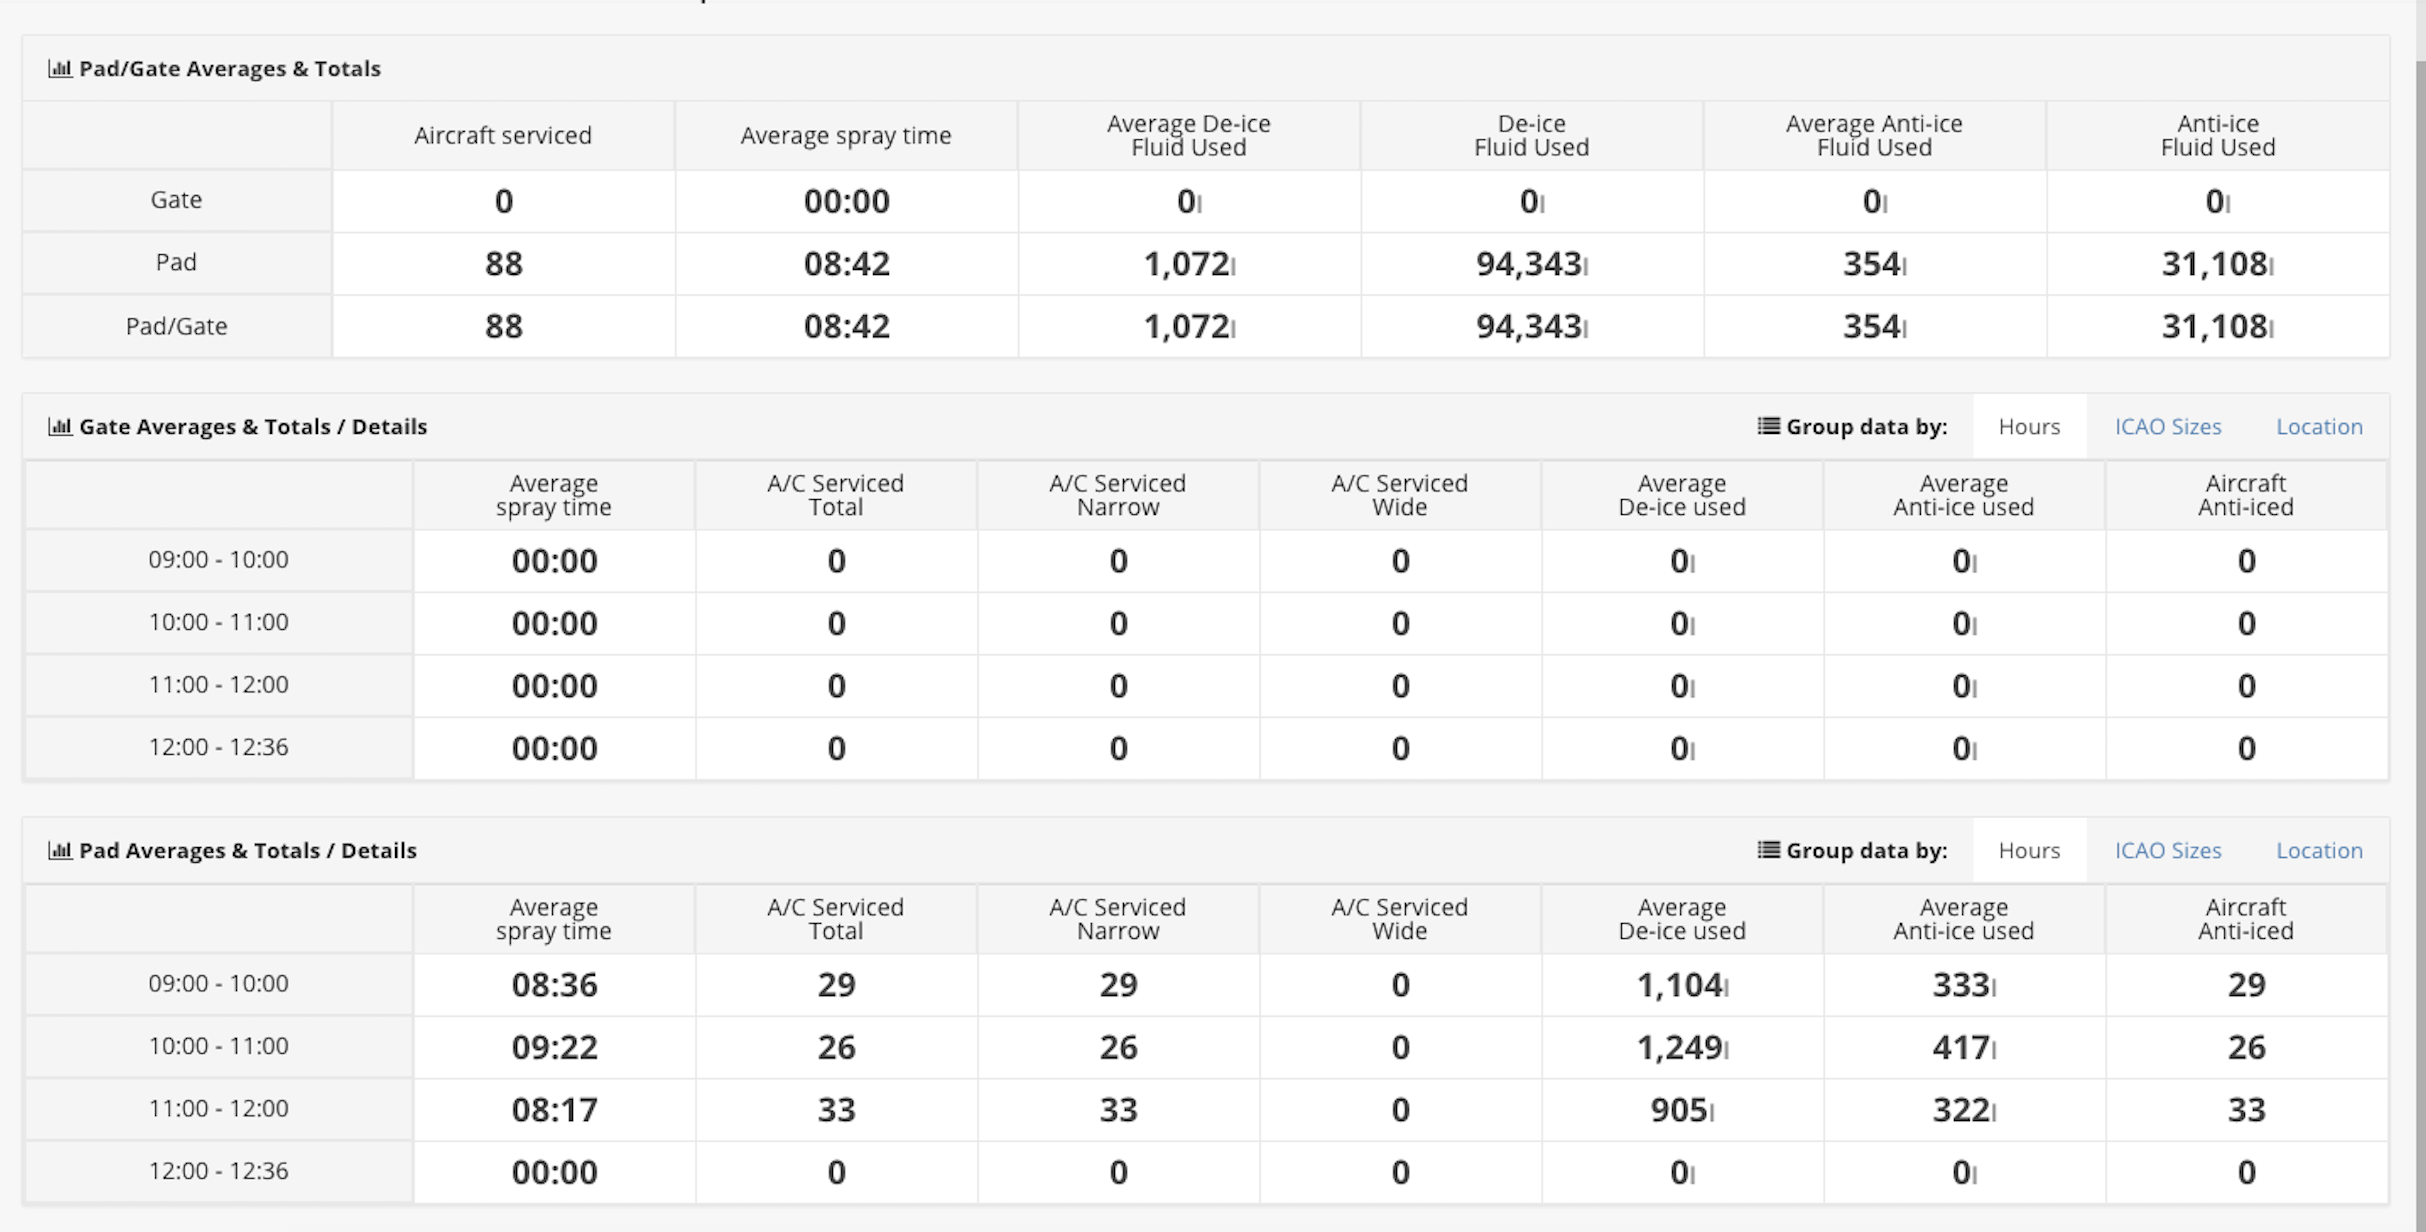
The real-time dashboard allows dispatchers and management to view the performance of the de-icing operations. Using information from the last three hours, various calculations are performed to provide the dispatchers and decision makers with accurate data. The data is analyzed separately for pad operations and gate operations; however, in locations where both exist, the data is then combined for overall reporting.
The dashboard page is divided into three tables as follows:
- Pad/Gate Averages and Totals – displays information on total aircraft sprayed, average spray time and average/total fluid used for both types of fluid;
- Gate Averages and Totals/Details – provides gate operation statistics defined in three tabs:
- Pad Averages and Totals/Details – provides gate operation statistics defined in three tabs:
Reporting Dashboard:
The performance monitor is accessed by clicking on the ‘DSLM’ logo in the upper left area of the toolbar on the main Icelink screen, as indicated by the red arrow in Figure 14.1.
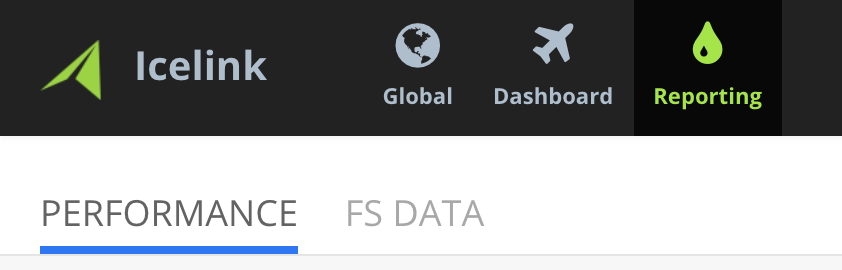
The reporting section has 2 tabs:
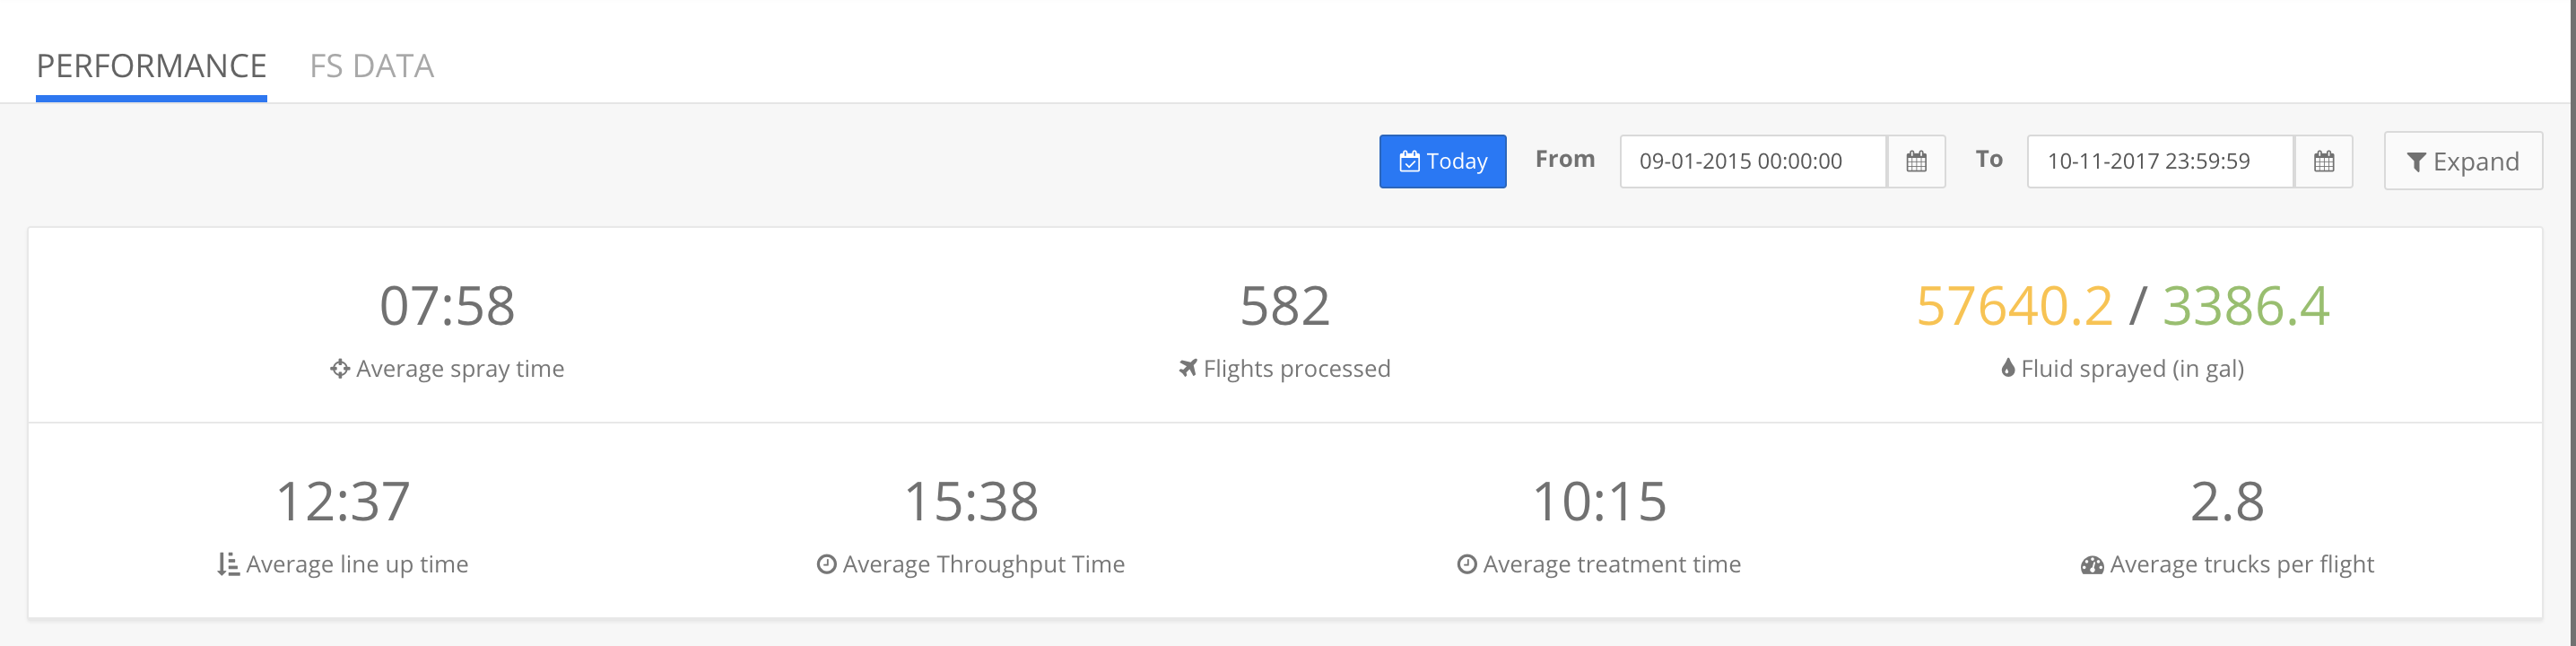
The performance monitor - allows users to review operational statistics for any time span. It provides the following performance and statistical data:
- Average Spray time – The length of time from the start of the first truck spraying to the end of last truck spraying;
- Average line up time – The time between the estimated pushback time to the brakes set/aircraft configured events;
- Average Treatment time – The time between the brakes set/aircraft configured events and the lead deicer completing the flight;
- Average Throughput time - Applicable to CDF only. The elapsed time between entering the CDF (ICP) to exiting the CDF (OCP)
- Total aircraft sprayed for the time span selected;
- Total fluid used for the time span selected;
- Average trucks used per flight for the time span selected.
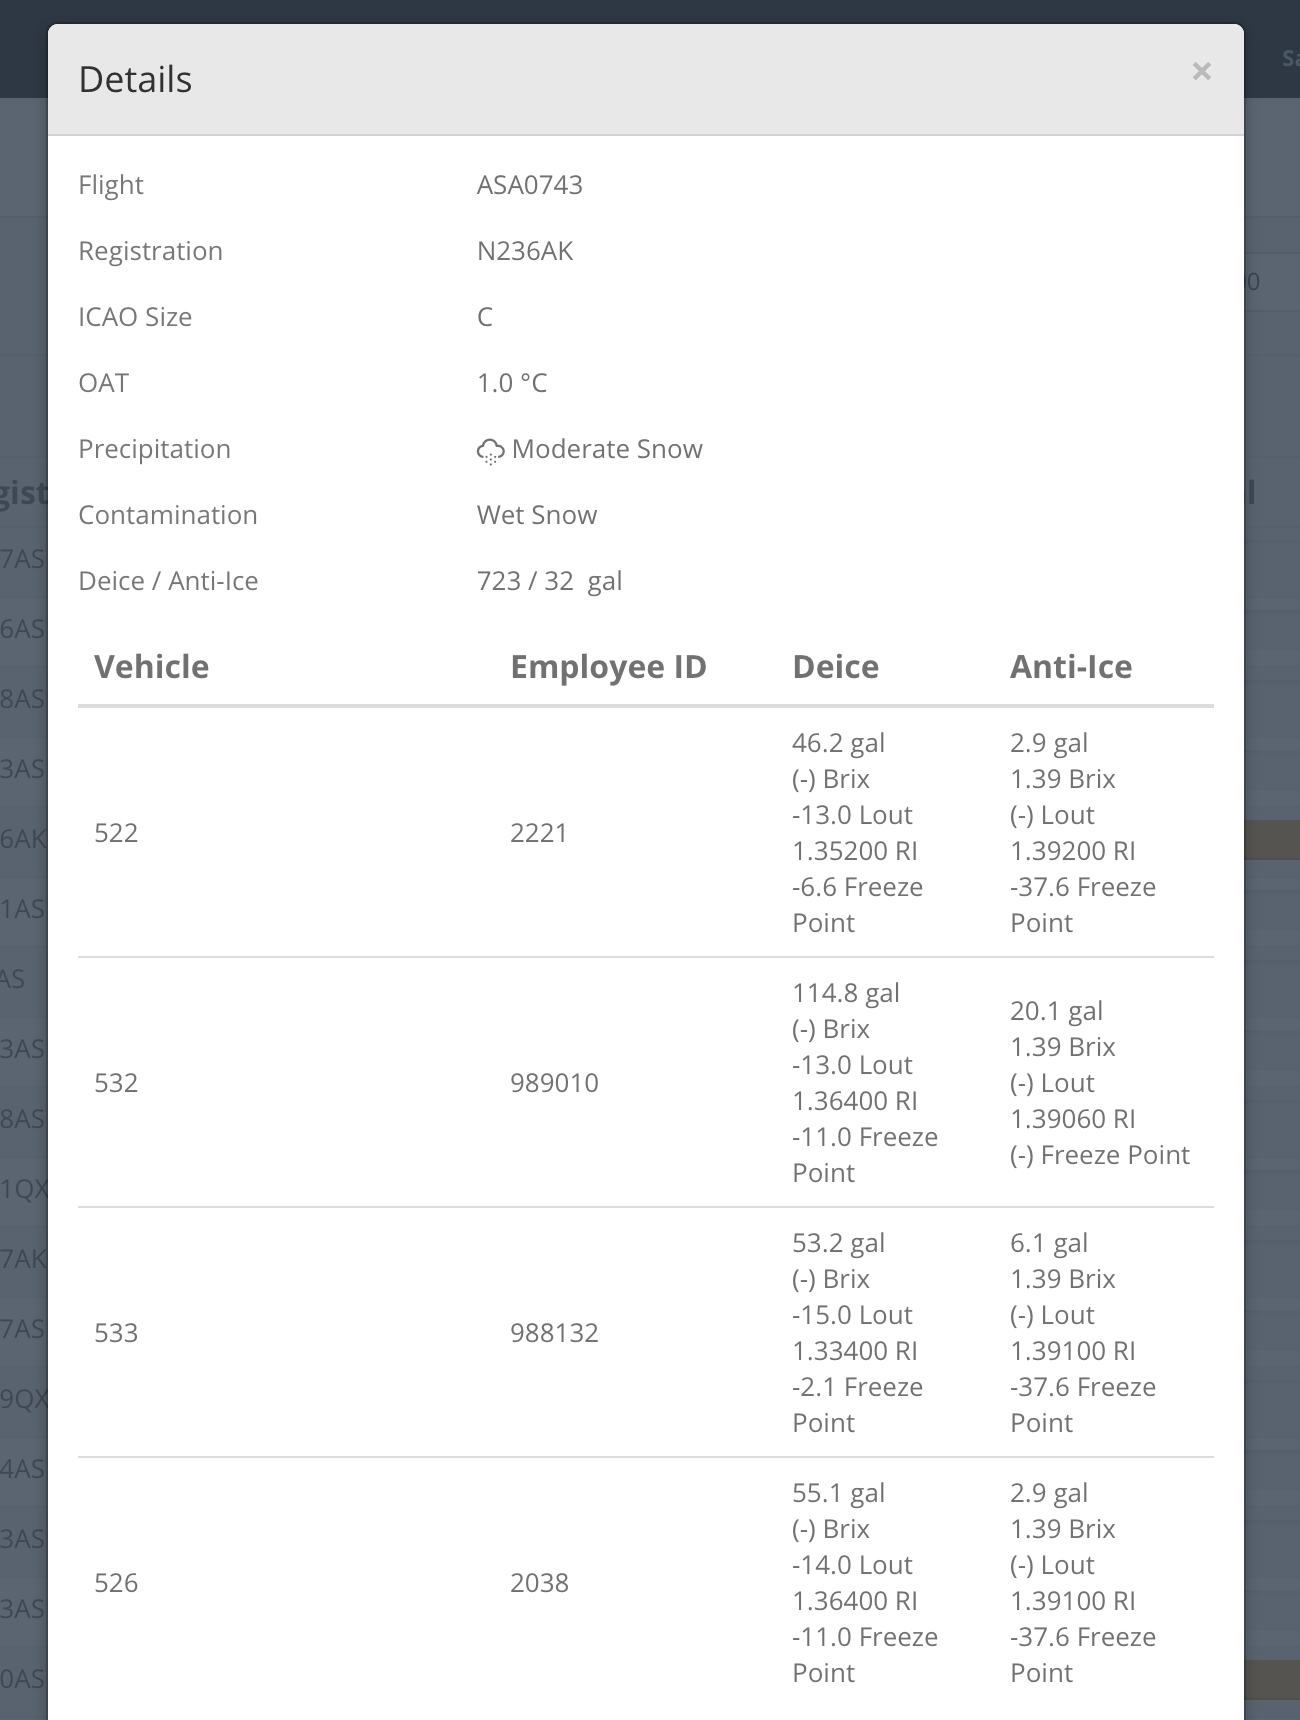
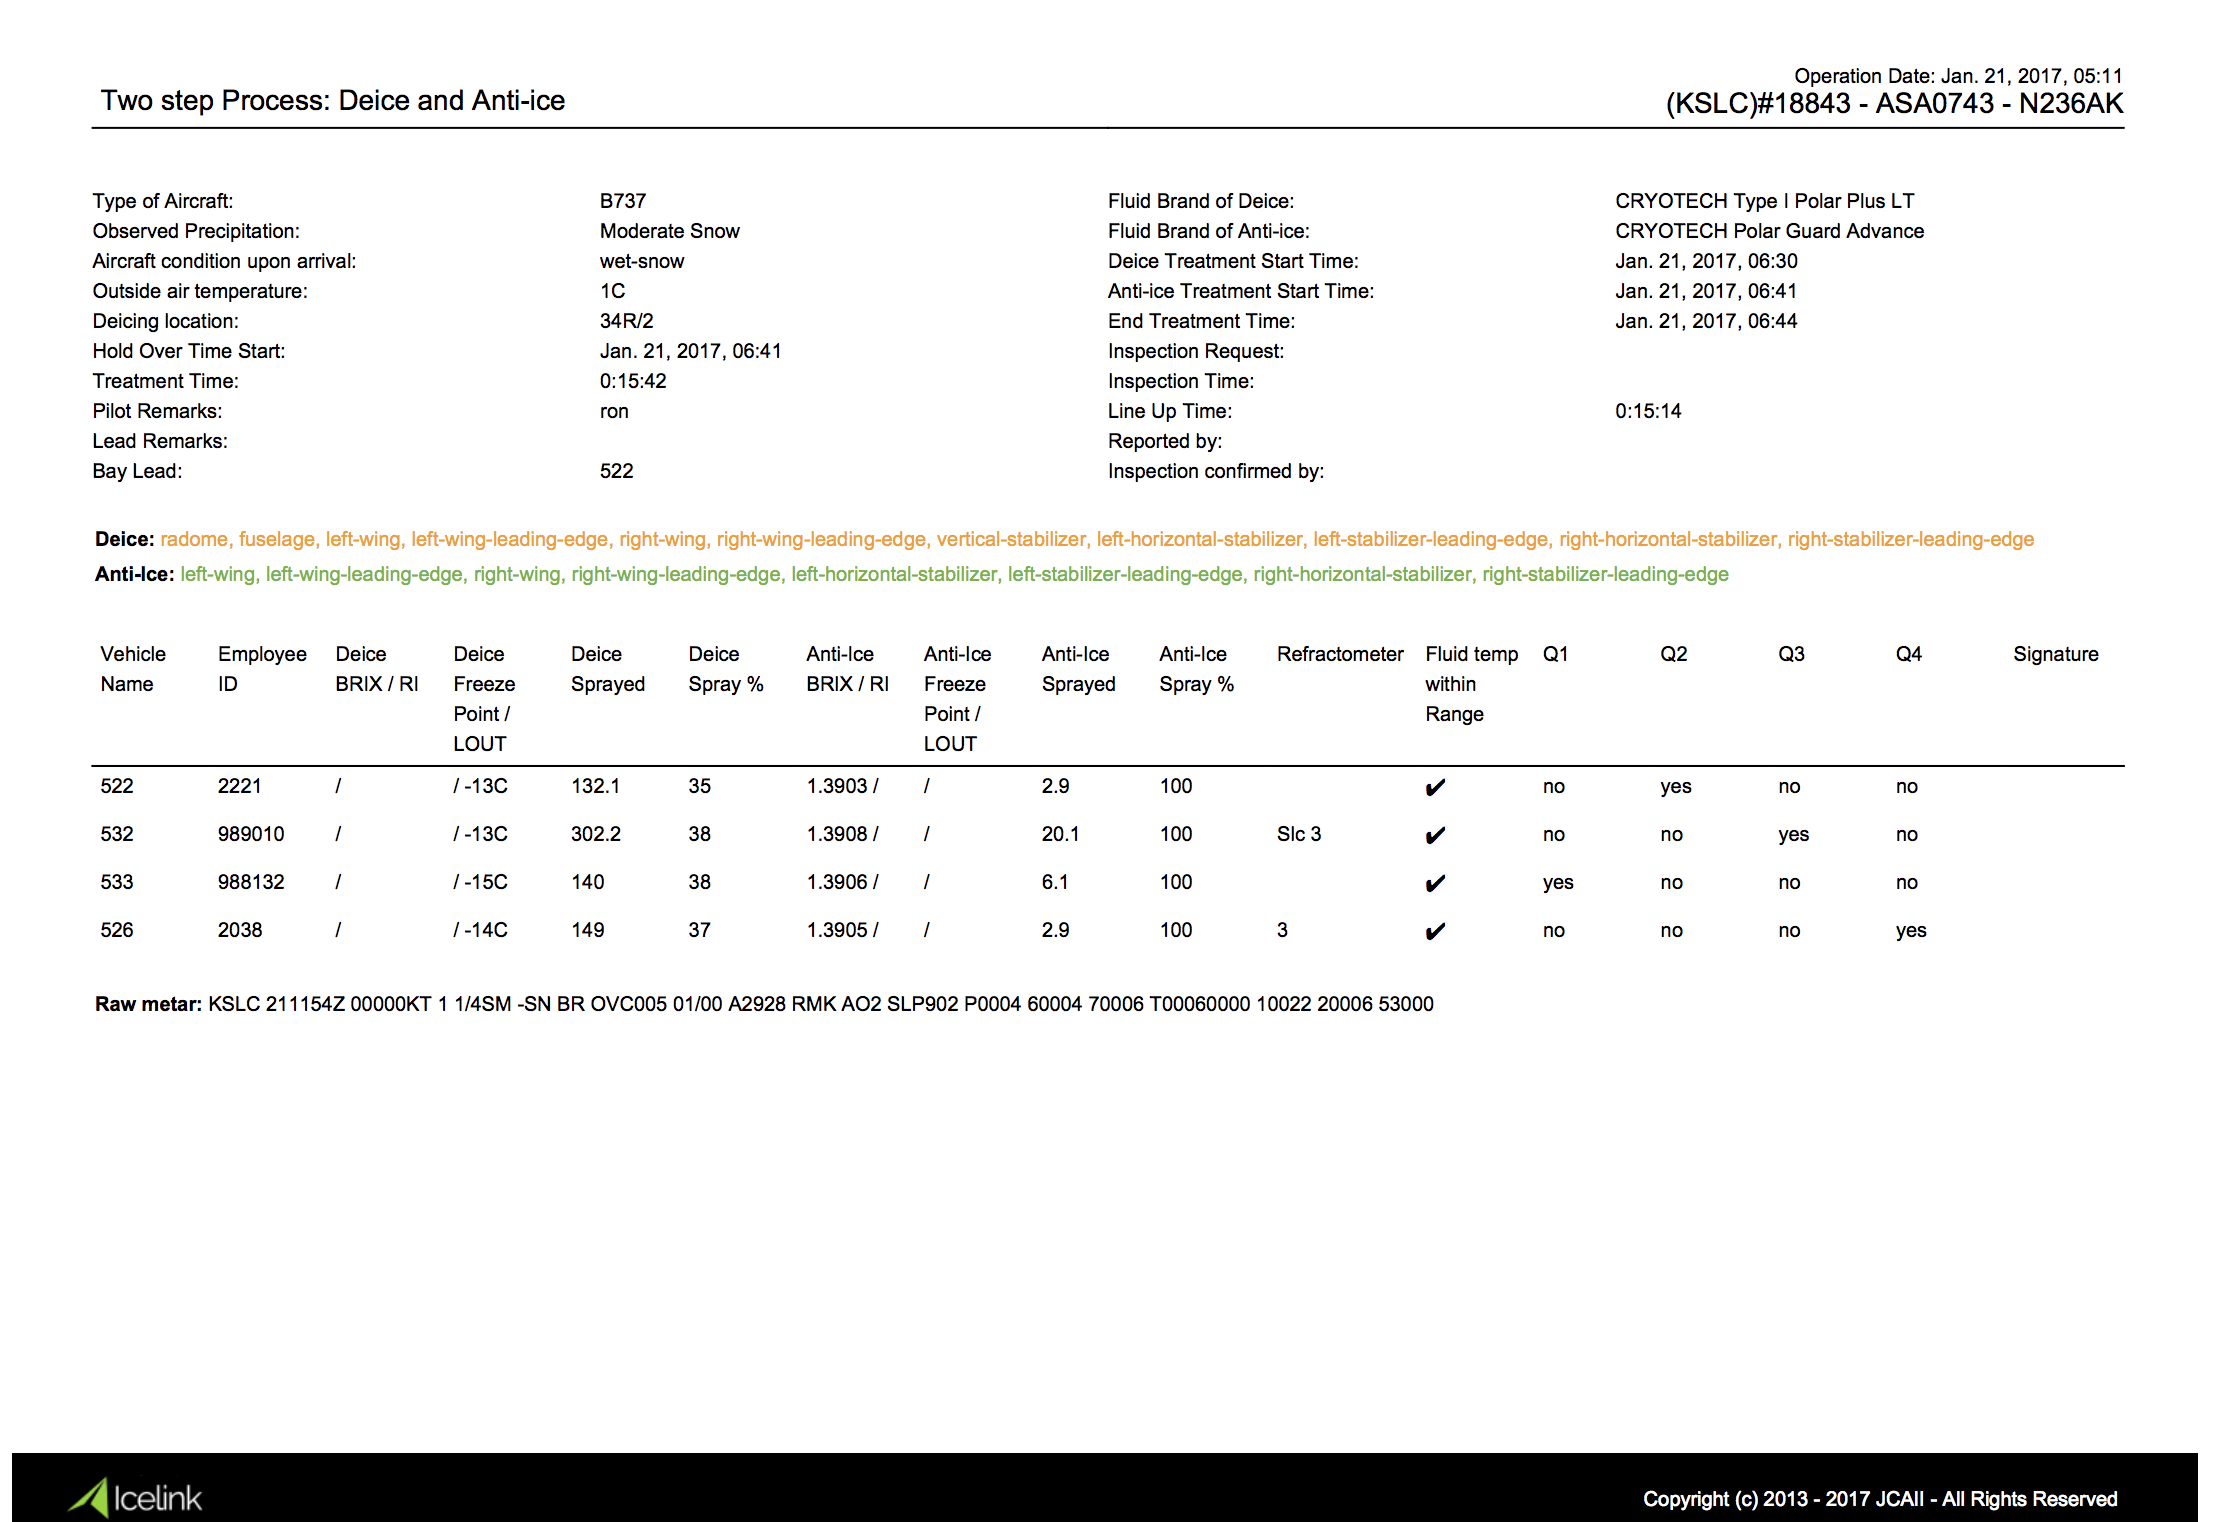
Flight Strip Data - Provides detailed information for each flight that was deiced. Each line in the table represents a deicing transaction with high level information regarding the flight. To explore additional information click the "eye" icon or the "page" icon.
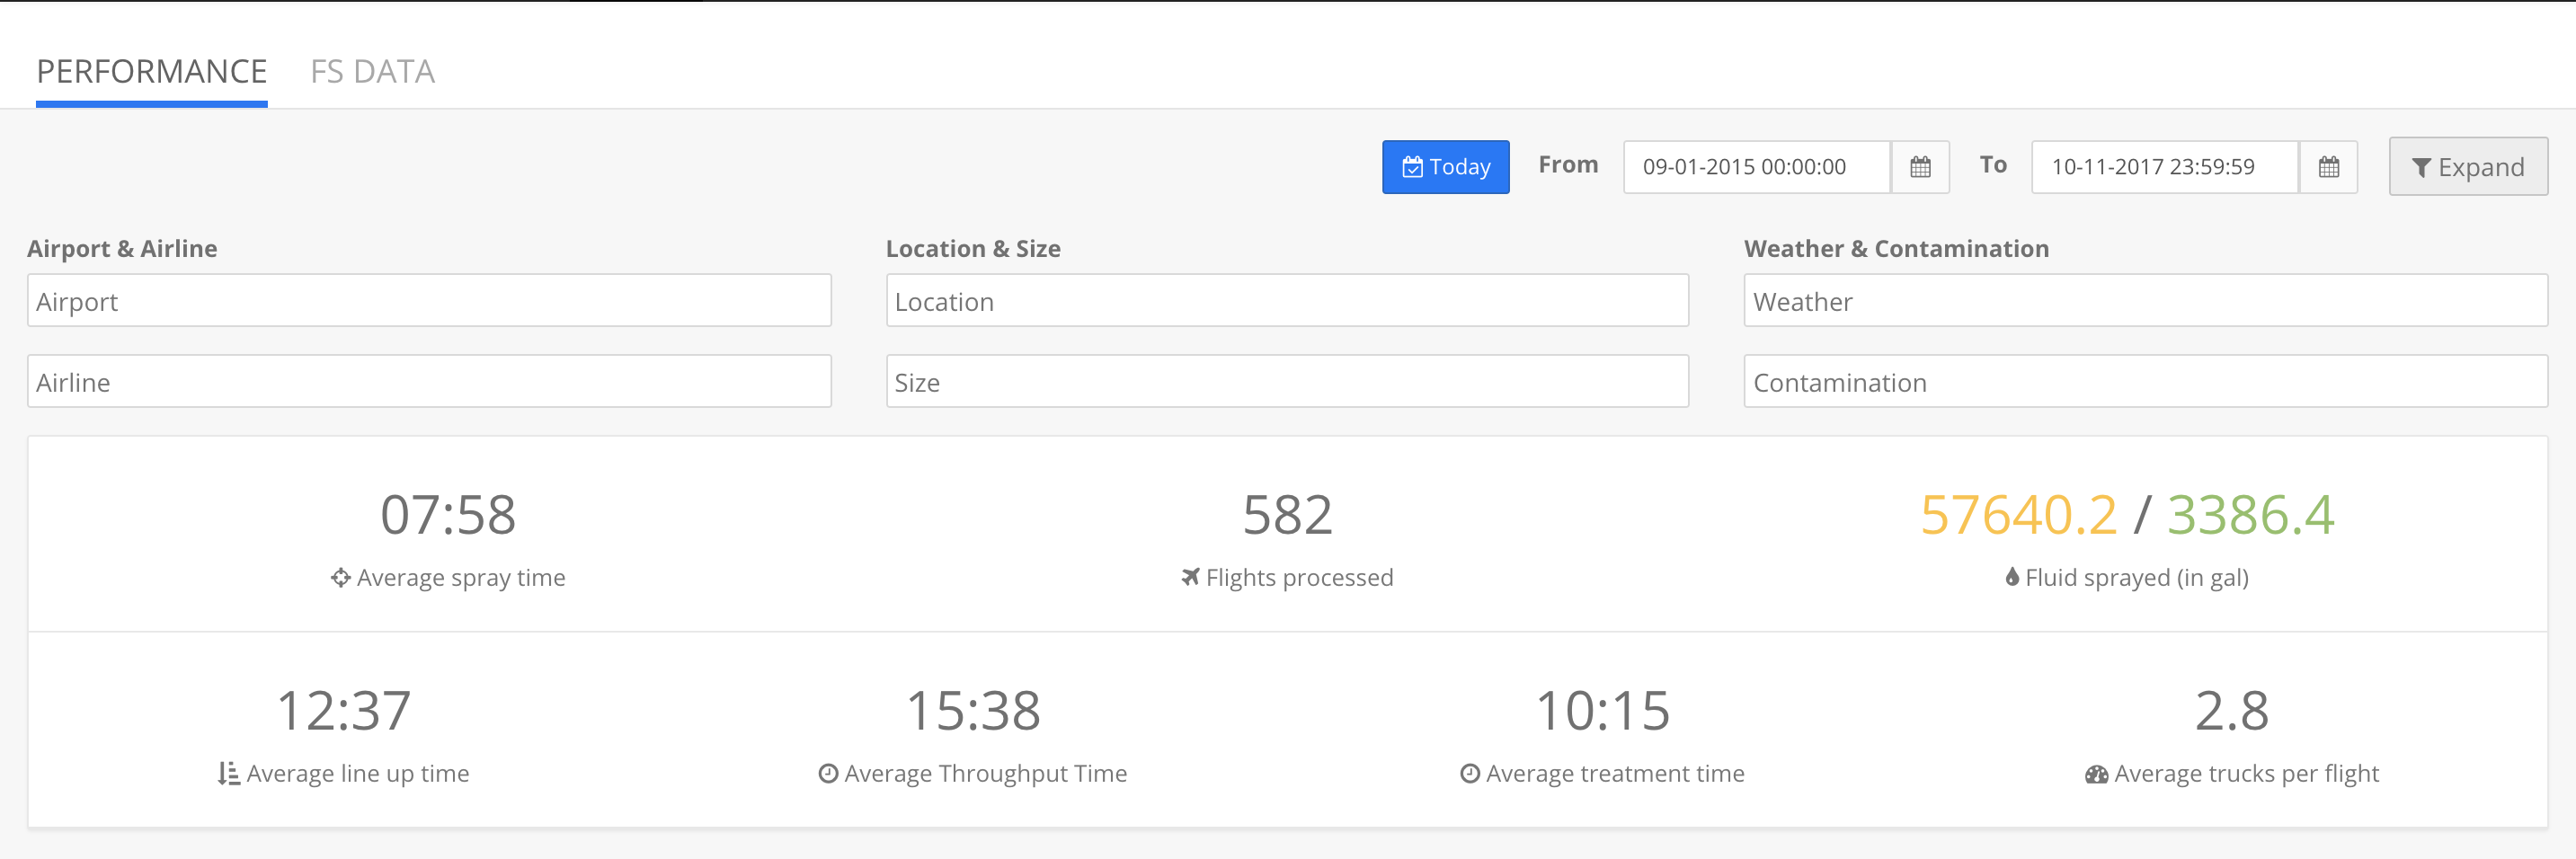
Information Filtering -
The system allows you to filter the information seen in the performance monitor and the FS Data page with 7 filters:
- time span
- Airport
- Airline
- Location
- Aircraft Size
- Active Weather
- Aircraft contamination
To display the filter interface click the "Expand" button next to the time fields.
0 Comments